

Rafe sits down with Dr Guillermo Miro – Application Engineer at Atten2 to discuss all things regarding online/inline oil sampling and analysis. He explains that the current suite of deployable sensors technologies cannot replace the testing offered in standard laboratories, but can offer some complementary data that enhances the overall view of equipment condition.
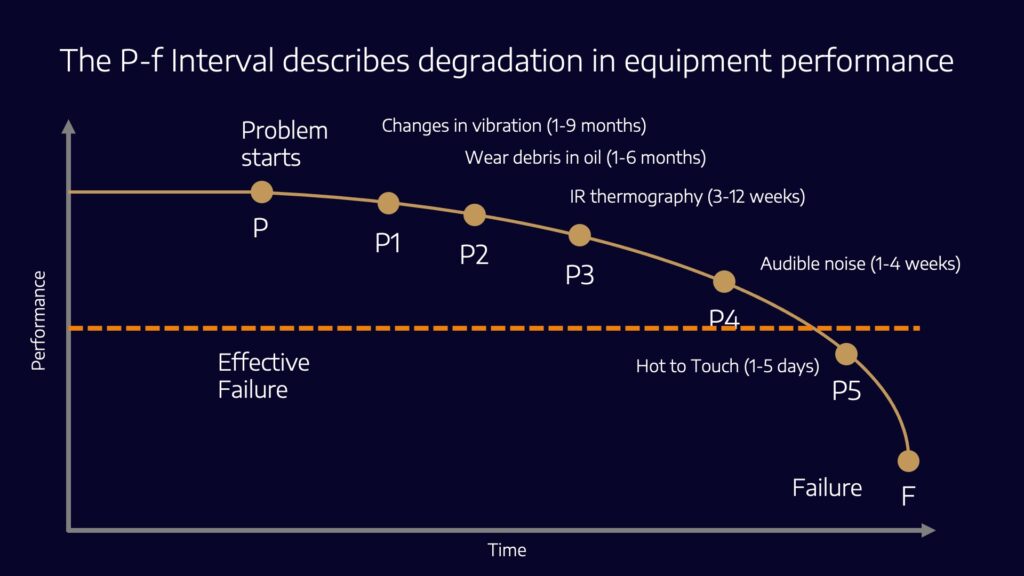
Rafe Britton: It sounds like the general use case for a lot of the sensor applications is twofold. One is from a post-mortem exercise standpoint. We can fill in the gaps in our data sets because with standard oil condition monitoring, we might only be taking a sample once every three months or even size months. And if the P to F interval is shorter than your interval between oil samples you have zero visibility on the failure. Even though online analysis might be a less complete data set than a full ab analysis, it still gives you the resolution to identify when a problem event might have occurred and when it started to degrade.
The second application is more to do with trending. Once you have the correlation between the lab and real-time data you can watch the degradation mechanisms occur in real time. Maybe you can forecast when the oil change is due. Do you see other applications?
Guillermo Miro: Yes, the postmortem analysis is true. You are just filling the gaps. I always use the same analogy. Imagine that you want to establish a surveillance system at your home and you have a choice. A high resolution camera that can catch the thief’s face and the police automatically will go to catch him. But the image is only taken at random time points. Or a very low resolution video that you see that somebody is jumping the fence.
Until now (with lab analysis) we just had the high-res camera, but it was capturing pictures at a random rate. So every three months you get a picture of the fence. It’s difficult to see if there was somebody climbing the fence. The video can help you choose when to take the photo. You can optimize the sample rates and also you can optimize what the lab is offering you because there is a lot of data on that.
A lot of times you’re just getting good [oil analysis] results every time and lab data. So the other part is development of normality models. Some companies or equipment manufacturers have learned that you can create a core view of normal operation parameters.
For example, imagine a gas turbine. At five megawatts power, your bearing temperatures ranging from A to B, inlet pressure is ranging from X to Y. Noise measured in the outside differently from 1 to 2.
There was no equivalent for real-time oil condition. Adding sensors helps you to add normality datasets into these models. You can feed oil condition monitoring data into your equipment model or your equipment and these help you to catch more failure modes.